

Data Analytics Strategies for Assessing Pollution Spread Using Sensor Data
Written by Paawan Sharma, Anurag Kandya, and Vipin Shukla
Data availability for monitoring pollution spread is gaining momentum with comprehensive and more straightforward provisioning of internet of things (IoT) network pollution sensors and satellite data. The widely used sensors include suspended particulate matter (SPM) capture in the form of PM2.5, PM10, CO2, and CO, hazardous gases, noise pollution, and light pollution. Identifying temporal, geological, and geographical relationships between various elements of captured data plays a crucial role in establishing and understanding the behavioral model of pollution generation and spread. IoT enables data capture with geo-tagging in order to map localized pollution footprints. Modern data analytics frameworks, either cloud-based or edge-based, provide great insight into the ocean of big data. The information extracted from in-depth data analysis is used in policy formulation to check pollution spread further. This article highlights the features of various enabler tools in this regard and presents a broader view of the optimal strategy for adopting a sensor network-based data analytics framework.
Introduction
Innovative smart city standard practices enable provisions for protecting and improving the environment through design and policy documents, which are enforced through laws around the world [1]. A stricter adherence to the law to protect and improve the natural environment in and around smart cities, including forests, lakes, rivers, and wildlife, is greatly emphasized in shaping relevant policies. The results provide important insights for the development of smart cities that not only provide core infrastructure but also emphasize a clean and sustainable environment [2]. These traits are strongly coupled with quality of life and this paper therefore aims to tackle the air pollution problem based on these laws.
Pollution Spread Iindicators in the Context of Smart Cities
The nature of air pollution is often related to the discharge and subsequent spread of pollutants. Almost all regions on the planet are affected by some form of deviation from an ecosystem balance. However, the affinity with which air pollution impacts humans and other forms of life has devastating effects on health, as well as life expectancy. The appearance of various biological symbols such as moss, long term shift in the health status of living beings, are some of the prime indicators of pollution spread. A report from WHO (World Health Organization), there will be a significant loss in people's lives due to climate change due to many factors with air pollution being a major component [3].
In the context of smart cities, the goal of an overall holistic, sustainable environment is of utmost importance in protecting the health of residents. The ever-increasing migration to urban areas and industrialization poses substantial demands on real-time sensor-based pollution data that has increased over the past decade. Although such requirements stress the integrity of the sensor data, the study of pollution spread dramatically depends on time-synchronized spatial-temporal patterns in the collected data. The fact of spatial relativity provides important insights into the geographical and climatic conditions across the smart city. Aerosol Optical Depth (AOD) data can also be a pointer to the PM (Particulate Matter) Pollution.
The importance of such data analysis becomes very crucial for major economies of the world, such as these areas: Brazil and India, and countries in Africa and South East Asia, etc., as they place greater emphasis on industrial development to boost the national economy and target larger market share at the global level. This, in turn, modulates the purpose of smart cities in a regional context, leading to a loss in the generality of intelligent city models.
Sensor and Networking Technology Status
The availability of low-cost and highly accurate sensors has fueled the deployment of sensor nodes and related wireless sensing networks (WSN) in strict adherence to the Internet of things framework. Micro-Electro-Mechanical Systems (MEMS) based sensors [4] are very promising when deployed at a mass scale. Miniaturized versions of sensors and Integrated Circuit (IC) based packaging of the required electronic signal processing make it extremely popular solutions for environmental sensing. This allows for digital conversion of the raw data as per the required format. The advances in communication technologies have resulted in open standard platforms for developing large wireless sensor networks. These include ZigBee and LoRa protocols for low data rate and less power consumption data networks [5].
Data Analytic Strategies
A huge volume of data is generated in the process of environmental monitoring, which is temporally and spatially distributed. In order to extract information from the collected raw data in most optimal way, the adoption of spatial-temporal data analysis strategy becomes crucial [6]. General framework is very much defined for any data analysis pipeline [7], the choice of various sub-blocks of the sequence of processes is primarily governed by specific application for which the data is generated. For example, pollution data for neighboring regions strongly emphasizes performing normalization of the data to earmark the relationship or dependence of data points at both locations. This helps in identifying and establishing a correlation between data segments.
Real Time Data Results
Even before performing information extraction techniques over raw data, a proper visualization helps identify key points or indicators for a case study of the feature extraction technique. The stationarity of data samples can be assumed with a fair degree of understanding of regional system dynamics, implying the absence of true non-stationary system behavior. Figures 1 to 2 shows plots of real-time satellite data with latitude and longitude as axis features and AOD (Aerosol Optical Depth) data as color information for two different days of the year 2019.

Figure 1: AOD data for Aqua-MODIS Aerosol optical thickness at 869 nm for 30 November 2019

Figure 2: AOD data for Aqua-MODIS Aerosol optical thickness at 869 nm for 09 December 2019
The visual inspection of such day-wise images suggests that the use of advanced techniques, such as machine learning-based optical flow analysis coupled with weather data like wind speed, would help formulate an appropriate model for the prediction of pollution levels at a particular location. Essentially, this problem lies in pattern recognition and tracking, where the specific pattern points to different levels of air pollution. A more generalized framework for model development in this regard is shown in Figure 3.
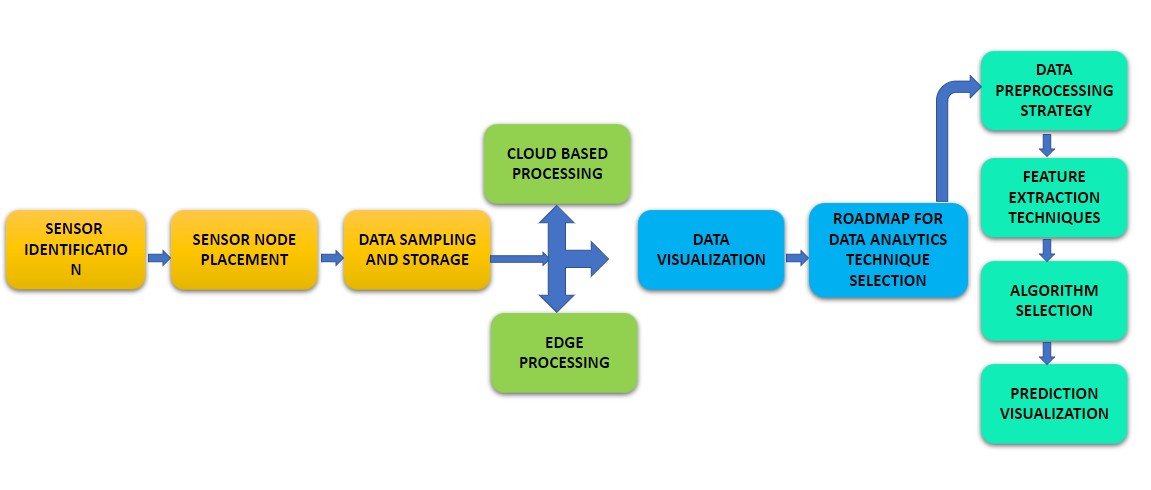
Figure 3: A Generalized framework for analytic strategy
Conclusion
The importance of sensor-based data collection and its subsequent analysis is increasing at a more incredible pace around the globe in multiple domains. This article tries to address the need for introspection into various options available for such purposes and also targets road-map design with the help of the right visualization tool at the initial stage itself. AOD can be a very good potential to assess a given region’s PM (particulate matter) measure and can be explored for its suitability. As the field of artificial intelligence is gaining rapid development in new algorithms and coding platforms, it becomes further crucial for technologists to adopt optimum project pipelines, thereby generating fruitful results.
References
- Smart Cities Mission Statement & Guidelines
https://smartcities.gov.in/themes/habikon/files/SmartCityGuidelines.pdf - Sustainable cities Health at the heart of urban development
https://www.who.int/publications/m/item/sustainable-cities - WHO guidelines for indoor air quality: selected pollutants
https://www.euro.who.int/__data/assets/pdf_file/0009/128169/e94535.pdf - Bogue, R. (2013). Recent developments in MEMS sensors: A review of applications, markets and technologies. Sensor Review.
- Wu, C. K., Tsang, K. F., Liu, Y., Zhu, H., Wang, H., & Wei, Y. (2020). Critical Internet of Things: An interworking solution to improve service reliability. IEEE Communications Magazine, 58(1), 74-79.
- Fong, B., Fong, A. C. M., Hong, G. Y., & Tsang, K. F. (2022). Optimization of Power Usage in a Smart Nursing Home Environment. IEEE Transactions on Industry Applications.
- New Frontiers in High Performance Computing and Big Data. Netherlands: IOS Press, 2017.
To view all articles in this issue, please go to October 2022 eNewsletter. For a downloadable copy, please visit the IEEE Smart Cities Resource Center.


To have the eNewsletter delivered monthly to your inbox, join the IEEE Smart Cities Community.
Past Issues
To view archived articles, and issues, which deliver rich insight into the forces shaping the future of the smart cities. Older eNewsletter can be found here. To download full issues, visit the publications section of the IEEE Smart Cities Resource Center.
IEEE Smart Cities Newsletter Editors

Managing Editor

Assistant Managing Editor
IEEE Smart Cities Publications Editorial Board
Luis M. Fernandez-Ramirez
Bernard Fong
Sergii Kushch
Prasad Enjeti
Rabie Ramadan
Ramkumar Lakshminarayanan
Francesco Flammini
Fateh Krim
Maria Pia Fanti
Kristina Kunert
Vladimir Orlic
Asif Ali Ahmed R
Werbeston Oliveira
Emilio Ghiani
Shafi Khadem
Nikumani Choudhury
Mohammad Zeyad
S.M. Masum Ahmed
Payman Dehghanian
Sona N Thadevus
Kumaresan Natarajan
Lues Felipe Gaitan Cubides
Chao Shen
Balaji Sankarshanan
Chun Sing Lai
Zhang Wei
Shashikant Patil
Sai Munikoti
Akhil Jabbar Meerja
Click here for more info
Loi Lei Lai
Editor-in-Chief
IEEE Smart Cities eNewsletter