

Predicting Covid-19 ICU Needs Using Deep Learning, XGBoost and Random Forest Regression with the Sliding Window Technique
Written by Aristeidis Mystakidis1, Nikolaos Stasinos1, Anestis Kousis1, Vangelis Sarlis1, Paraskevas Koukaras1, Dimitris Rousidis1, Ioannis Kotsiopoulos2, and Christos Tjortjis1*
The effects of COVID-19 have caused severe strains to healthcare systems globally. Healthcare infrastructures are tested to their limits in almost every country and city, smart or not. This article utilizes deep and machine learning forecasting algorithms, such as Artificial Neural Networks (ANN), XGBoost and Random Forest. Using the sliding window technique, we predict the expected number of Intensive Care Unit (ICU) beds required for short (one week), mid (two weeks) and longer term (three weeks) time frames. We consider daily confirmed COVID-19 cases, current ICU, regular and special bed occupation, hospitalized cases, recovered and intubated patients and deaths. Results show that the models demonstrate very high coefficient of determination (R2) in the training phase, whilst providing accurate predictions in the forecasting phase. We report the weighted average output of ANN, XGBoost and Random Forest, which resulted in very low Mean Absolute Percentage Error (MAPE). The accurate and timely prediction of ICU beds can support decision making for Healthcare Systems, optimizing deployment of resources, as needed. Our approach can be enhanced by incorporating non-clinical parameters, based on smart city infrastructures, such as data from smart sensors.
1. Introduction
The recent COVID-19 pandemic caused a worldwide crisis [1], [2], motivating the research community to attempt to address various of its facets [3], [4]. A multivariable regression model, developed on hospitalized COVID-19 positive patients and based on the TRIPOD guideline (Transparent reporting of a multivariable prediction model for individual prognosis or diagnosis) [5], reached an accuracy of 74% for predicting ICU admissions and 83% for predicting mortality [6]. Several classification models predict level-of-care requirements based on clinical and lab data [7], [8], [9]. Another research considers 2,566 COVID-19 patients with the model output achieving 88% accuracy for hospitalization, 87% for ICU and 86% for mechanical ventilation requirements [10].
A Machine Learning (ML) risk-based prioritization tool was utilized to forecast imminent ICU Transfer in Hospitalized COVID-19 patients for a 24-hour period. Timeseries data, such as vital signs, nursing assessments, laboratory data, and electrocardiograms, were used to train a Random Forest (RF) model. The dataset consisted of 1,987 COVID-19 patients who were admitted to non-ICU hospital units. The model achieved 76.2% accuracy [11]. In a similar study, researchers developed a Deep Learning prediction model for the likelihood of ICU admission and mortality. They collected data about chronic comorbidities, vital signs, symptoms laboratory tests on admission and demographics [2].
Many studies aim to detect early predictive factors upon admission for enhancing the management of patients moved to ICUs ([4], [7], [12]). Others, try to forecast the spread of COVID-19 and ICU requirements, utilizing regression analysis (autoregressive integrated moving average - ARIMA) [13] in confirmed cases, for predicting future cases [3]. For short-term forecasting of ICU beds, a combination of autoregressive models, ML and epidemiological models yielded promising results. Such an approach demonstrated average forecasting errors of 4% and 9% for one- and two-week ahead, respectively, outperforming several other competing forecasting models [3].
2. Methodology
In our work, we aimed to predict ICU needs by collecting weekly data from the Greek Ministry of Health ([14], [15]) and other sources, and pre-processing them to improve modelling and forecasting [16], [17]. COVID-19 cases, ICU beds, hospitalized, intubated, recovered, and deaths are among the parameters we used. We conducted data analysis and evaluation and report here on short-, mid- and longer-term results for the timeframe from December 28, 2020 up to March 22, 2021.
We utilized a triple-model forecasting approach to minimise MAPE, focusing on ICU beds [18], [19]. We used three prediction models: ANN, XGBoost and Random Forest [20], [21], [22], [23]. The utilization process incorporates the sliding window technique [24], combining seven timestamps, each representing a single day’s data. Each algorithm is trained with input parameters such as daily positive cases, current ICU, regular/special bed occupation, hospitalized cases, recovered/intubated patients, imported cases and deaths for days n – 7, n – 6, …, n – 1. There are 21 different training executions having as target the ICU beds needed for day n, n + 1, …, n + 20. As a result, 21 different executions abide with the same data architecture and hyperparameters, but follow a different process for training.
The most accurate prediction for the period from December 28, 2020, up to March 22, 2021 was reported by the weighted average output of combining ANN, XGBoost and Random Forest.
3. Results & Evaluation
The evaluation of each model was based on the Coefficient determination (Equation 1) [25], [26].
Equation 1: Coefficient of determination (R2).
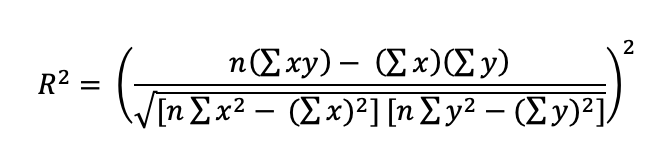
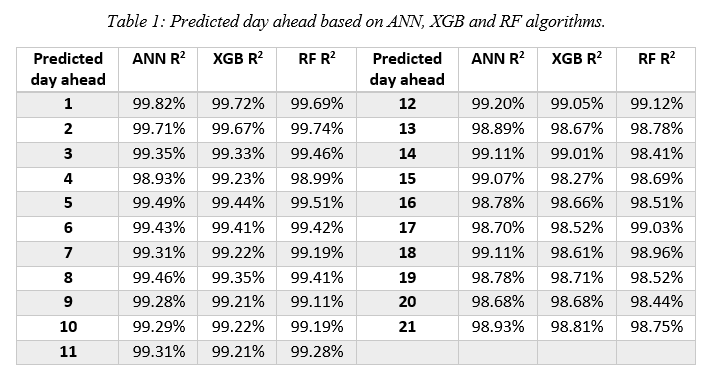
Where n is the total number of values, x is the actual value and y is the forecast value. Each model scored above 99% for 12 days ahead, and above 98% for 13 to 21 days ahead (Table 1).
To assess the reliability of combining the three algorithms, we used MAPE (Equation 2) to measure the error of predicted values against actual results for a target date.
Equation 2: Mean Absolute Percentage Error (MAPE).
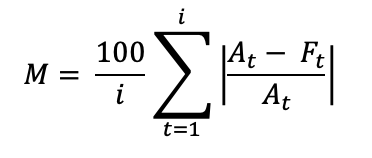
Where i is the number of fitted points, t the timestamp, At is the actual value and Ft is the forecast value. We note that incorporating a 3-day moving average MAPE (comparing forecasts with the average of the target date and its two previous days), further enhances results (Table 2).
Table 2: Forecasting method MAPE based on daily results and 3-day moving average.
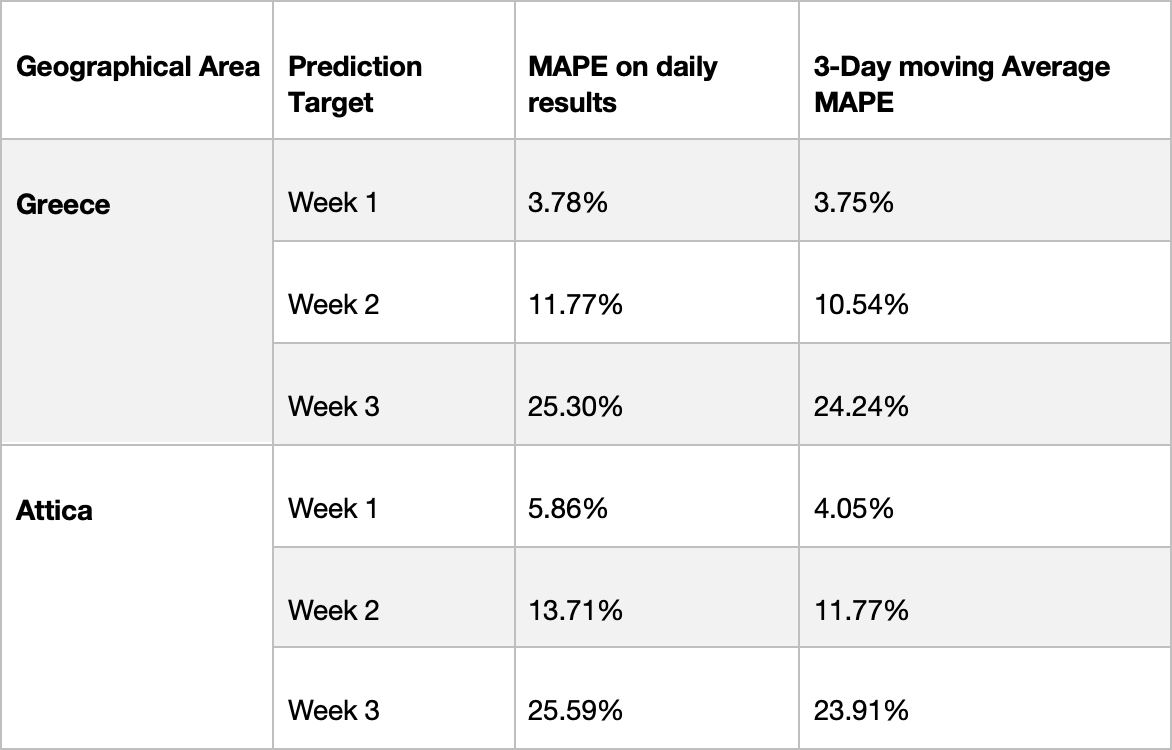
We focus on Greece as well as the Attica region. As far as Greece is concerned, for week ahead predictions and the period from January 4, 2021 to March 22, 2021 the “actual data” average MAPE was 3.78%, while the 3-day moving average was 3.75%. For the two weeks ahead prediction, from January 11th to March 22nd the “actual data” average MAPE was 11.77%, whereas the 3-day moving average was 10.54%. Finally, for three weeks ahead prediction, from January 18th to March 22nd the “actual data” average MAPE was 25.30%, while the 3-day moving average was 24.24%.
For Attica the reported predictions start from February 1 2021. For the next week predictions, from February 1st to March 22nd the “actual data” average MAPE was 5.86%, while the 3-day moving average was 4.05%. Regarding the two weeks ahead prediction, from February 8th to March 22nd the “actual data” average MAPE was 13.71%, while the 3-day moving average was 11.77%. Finally, for the three weeks ahead prediction, from February 15th to March 22nd the “actual data” average MAPE was 25.29%, whereas the 3-day moving average was 23.91%.
4. Conclusion
Results show that the best individual model in terms of R2 was ANN with an average value of 99.17% over 21 days, RF and XXB coming close second and third with 99.06% and 99.05% respectively. For one and two weeks ahead predictions, the best average model MAPE was achieved for Greece, whilst for three weeks ahead it was the one for Attica. Furthermore, for all three time periods (one-two-three weeks) and for both Greece and Attica the predictions had lower MAPE for 3-day moving average results compared to daily results. Finally, ongoing and future work include the utilization of several other indicators, such as the impact of temperature, climate and incubation period combined with demographics, country characteristics or government mitigation actions (lockdown, social distancing, vaccinations etc.), aiming to further enhance prediction performance.
References
- J. A. Teixeira da Silva and P. Tsigaris, “The role of lockdowns and health policies for COVID-19 in Italy,” Ital. J. Med., no. March, 2020, doi: 10.4081/itjm.2020.1366.
- W. J. Guan et al., “Clinical Characteristics of Coronavirus Disease 2019 in China,” N. Engl. J. Med., vol. 323, no. 16, pp. 1545–1546, 2020, doi: 10.1056/NEJMoa2002032.
- M. Goic, M. S. Bozanic-Leal, M. Badal, and L. J. Basso, “COVID-19: Short-term forecast of ICU beds in times of crisis,” PLoS One, vol. 16, no. 1 January, pp. 1–24, 2021, doi: 10.1371/journal.pone.0245272.
- Y. Allenbach et al., “Development of a multivariate prediction model of intensive care unit transfer or death: A French prospective cohort study of hospitalized COVID-19 patients,” PLoS One, vol. 15, no. 10 October, pp. 1–12, 2020, doi: 10.1371/journal.pone.0240711.
- G. S. Collins, J. B. Reitsma, D. G. Altman, and K. G. M. Moons, “Transparent reporting of a multivariable prediction model for individual prognosis or diagnosis (TRIPOD): the TRIPOD statement,” J. Br. Surg., vol. 102, no. 3, pp. 148–158, 2015.
- Q. Li et al., “Early Transmission Dynamics in Wuhan, China, of Novel Coronavirus–Infected Pneumonia,” N. Engl. J. Med., vol. 382, no. 13, pp. 1199–1207, 2020, doi: 10.1056/nejmoa2001316.
- E. R. Lusczek et al., “Characterizing COVID-19 clinical phenotypes and associated comorbidities and complication profiles,” medRxiv, pp. 1–18, 2020, doi: 10.1101/2020.09.12.20193391.
- A. Banerjee et al., “Estimating excess 1- year mortality from COVID-19 according to underlying conditions and age in England: a rapid analysis using NHS health records in 3.8 million adults,” medRxiv, no. March, p. 2020.03.22.20040287, 2020, doi: https://doi.org/10.1101/2020.03.22.20040287.
- S. P. J. M. Horbach, “No time for that now! Qualitative changes in manuscript peer review during the Covid-19 pandemic,” Res. Eval., pp. 1–9, 2021, doi: 10.1093/reseval/rvaa037.
- L. Wynants et al., “Prediction models for diagnosis and prognosis of covid-19 infection: Systematic review and critical appraisal,” BMJ, vol. 369, 2020, doi: 10.1136/bmj.m1328.
- C. Huang et al., “Clinical features of patients infected with 2019 novel coronavirus in Wuhan, China,” Lancet, vol. 395, no. 10223, pp. 497–506, 2020, doi: 10.1016/S0140-6736(20)30183-5.
- C. Anastassopoulou, L. Russo, A. Tsakris, and C. Siettos, “Data-Based Analysis , Modelling and Forecasting of the COVID-19 outbreak,” PLoS One, vol. 15, no. 3, pp. 1–21, 2020, doi: 10.1371/journal.pone.0230405.
- G. E. P. Box and G. M. Jenkins, “Control,” Halden-Day, San Fr., 1970.
- “NPHO. 2020. Home - NPHO EODY.” [Online]. Available: https://eody.gov.gr/category/covid-19. [Accessed: 20-April-2021].
- “Ministry of Health Data resource.” [Online]. Available: https://www.pio.gov.cy/coronavirus/eng. [Accessed: 29-April-2021].[16]
- “Worldmeter - Coronavirus Pandemic.” [Online]. Available: https://www.worldometers.info/coronavirus/. [Accessed: 06-May-2021].
- “Coronavirus COVID-19 Global Cases by the Center for Systems Science and Engineering (CSSE) at Johns Hopkins University (JHU).” [Online]. Available: https://coronavirus.jhu.edu/map.html. [Accessed: 06-May-2021].
- B. H. Andrews, M. D. Dean, R. Swain, and C. Cole, “Building ARIMA and ARIMAX Models for Predicting Long-Term Disability Benefit Application Rates in the Public / Private Sectors Sponsored by Society of Actuaries Health Section Prepared by University of Southern Maine,” Soc. Actuar., no. August, 2013.
- N. Yau, Visualize this: The flowingData Guide to Design, Visualization, and Statistics. 2011.
- A. Géron, Hands-on Machine Learning with Scikit-Learn, Keras, and TensorFlow. O’Reilly Media, 2019.
- J. Grus, Data Science from Scratch from First Edition. O’Reilly Media, 2019.
- M. J. Kane, N. Price, M. Scotch, and P. Rabinowitz, “Comparison of ARIMA and Random Forest time series models for prediction of avian influenza H5N1 outbreaks,” BMC Bioinformatics, vol. 15, no. 1, 2014, doi: 10.1186/1471-2105-15-276.
- S. Madhavan, Mastering Python for Data Science. 2015.
- C.-H. Lee, C.-R. Lin, and M.-S. Chen, “Sliding-window filtering: an efficient algorithm for incremental mining,” in Proceedings of the tenth international conference on Information and knowledge management, pp. 263–270, 2001.
- B. Ratner, Statistical and machine-learning data mining: Techniques for better predictive modeling and analysis of big data, third edition. 2017.
- J. Song and T. M. Song, Big Data Analysis Using Machine Learning for Social Scientists and Criminologists. Cambridge Scholars Publishing, 2019.
This article was edited by Bernard Fong
For a downloadable copy of the July 2021 eNewsletter which includes this article, please visit the IEEE Smart Cities Resource Center.


To have the eNewsletter delivered monthly to your inbox, join the IEEE Smart Cities Community.
Past Issues
To view archived articles, and issues, which deliver rich insight into the forces shaping the future of the smart cities. Older eNewsletter can be found here. To download full issues, visit the publications section of the IEEE Smart Cities Resource Center.
IEEE Smart Cities Newsletter Editors

Managing Editor

Assistant Managing Editor
IEEE Smart Cities Publications Editorial Board
Luis M. Fernandez-Ramirez
Bernard Fong
Sergii Kushch
Prasad Enjeti
Rabie Ramadan
Ramkumar Lakshminarayanan
Francesco Flammini
Fateh Krim
Maria Pia Fanti
Kristina Kunert
Vladimir Orlic
Asif Ali Ahmed R
Werbeston Oliveira
Emilio Ghiani
Shafi Khadem
Nikumani Choudhury
Mohammad Zeyad
S.M. Masum Ahmed
Payman Dehghanian
Sona N Thadevus
Kumaresan Natarajan
Lues Felipe Gaitan Cubides
Chao Shen
Balaji Sankarshanan
Chun Sing Lai
Zhang Wei
Shashikant Patil
Sai Munikoti
Akhil Jabbar Meerja
Click here for more info
Loi Lei Lai
Editor-in-Chief
IEEE Smart Cities eNewsletter