

Data Analytics Using Open Source Tools for a Smart City Situational Awareness Solution at the Edge
Written by Neethu Elizabeth Simon and Samantha Coyle
Smart cities need smart security solutions to keep assets and the public safe and secure. Surveillance cameras are installed across various parts of smart cities to ensure the safety of everyone as well as their surrounding environment. With the advent of the Internet of Things (IoT) combined with advancements in computer vision (CV) and AI/ML, security-as-a-service solutions are becoming more important in enhancing safety in a smart city.
This paper proposes a CV-based Security-as-a-Service Smart City Solution using AI/ML. This solution provides a framework and processing pipeline for deploying an AI-assisted, multi-camera Smart City Solution for monitoring vehicular and walkway traffic. Analytics dashboard displays camera installation locations on the smart city map such that data analytics captured across the city can improve situational awareness. They can also be leveraged to provide notifications and safety-related alerts.
The proposed solution illustrates a web user-interface (UI) architecture that utilizes Open-Source software tools for data visualization to improve situational awareness. It covers various Grafana [1] dashboards and plugins used along with metrics captured via AI model inferencing to provide insights about their surroundings. We also discuss privacy and security considerations concerning the use of security cameras while developing a CV-based AI/ML data visualization solution for situational awareness.
Design & Architecture
This implementation enables an AI-assisted reference design achieving situational awareness and property security and management data analytics. It focuses on user interface pieces leveraging Open-Source software tooling that interact with several Go [2] microservice APIs to search camera metadata for registered cameras, attain a list of indexed models, layers, and labels, and to find video sessions assigned to a particular label by an inference model, and a video service providing endpoints to serve playlists and video segment data. Go microservices interface with the Open-Source Postgres [3] database for data storage and retrieval.
Figure 1 shows the frontend architecture leveraging a containerized microservice-based architecture for storing and displaying Smart City Situational Awareness solution data analytics. The diagram displays the flow of data with Go APIs interfacing with data storage, and Web UI framework built to display Smart City data to include Angular [4] UI framework and Grafana dashboards.
The data stored includes:
- Camera metadata: location, RTSP URI, direction facing, description, ML pipeline to run for camera feed
- Binary data for video frames using Binary Columns & PostgreSQL’s [3] declarative partitioning, to allow easier lookups
- Inference results from applying ML models using the OpenVINO [5] Inference Engine
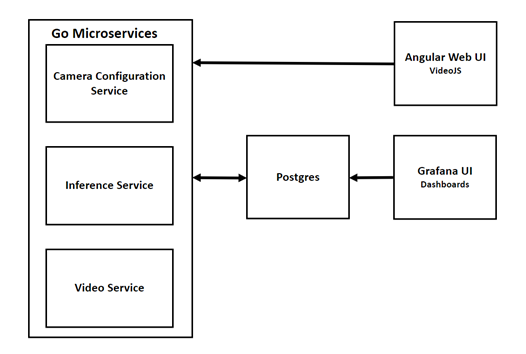
Figure 1: Solution Architecture.
Go microservices are primarily used by the Angular Web UI framework to access APIs and display data for live camera streaming, interfacing with one click to Grafana through a navigation bar and display previous video recordings using VideoJS. VideoJS is an HTML5 media player framework to show video in a browser served via a typical HTTP server.
Figures 2-6 demonstrate key features of the UI leveraged for a Smart City Data Analytics Solution including the home page, camera configuration, visualization of live camera, and stored video stream. By having a single UI, it enables a seamless flow to navigate analytics from adding cameras, to visualizing inference results in Figure. 7.

Figure 2: Web UI – Home Page.
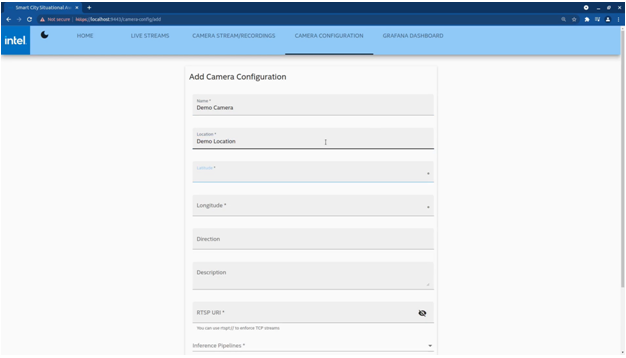
Figure 3: Web UI – Add Camera.

Figure 4: Web UI – View Cameras.
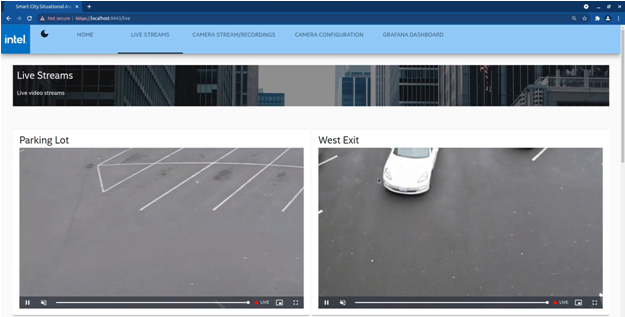
Figure 5: Web UI – View Camera Live Feeds.
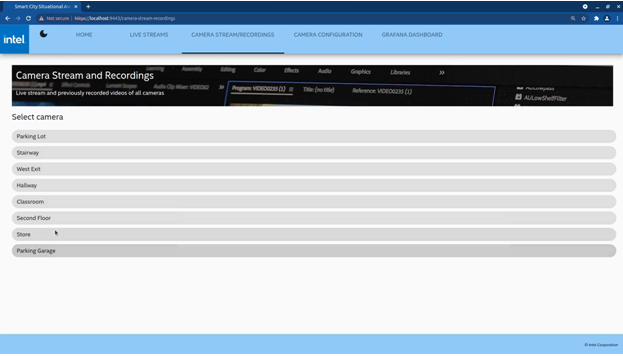
Figure 6: View Available Cameras with Feed.

Figure 7: Web UI – View Camera Feed Inference Results.
Grafana is a data visualizations, insights, and metrics Open Source tool leveraged to further enhance the data analytics for this Smart City solution. It is configured with a world map plugin to visualize edge device (i.e. camera) locations and contains custom queries leveraging Postgres solution storage and Go microservices APIs. It uses read-only database credentials where credentials populate data source configuration files. Upon startup, a default dashboard is provisioned for camera location visualization. A user may navigate to the default dashboard, shown in Figure 8, by selecting the Grafana tab in Angular UI top navigation bar (Figure 2).
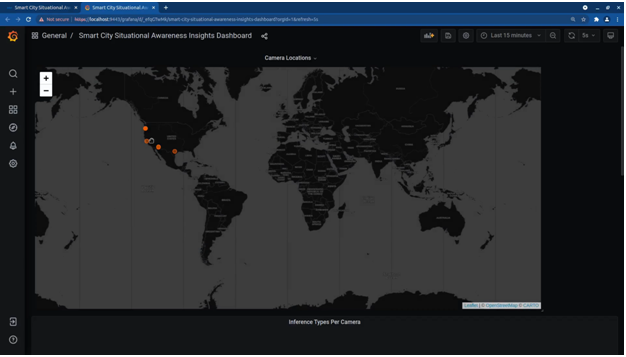
Figure 8: Grafana – Default Dashboard.

Figure 9: Grafana – Edge Device Locations on World Map.
Figures 10 and 11 highlight the value Grafana custom dashboards enable. Dashboards demonstrate inference results from applying person, vehicle, and bicycle detection, and age and gender recognition models from OpenVINO Model Zoo to video data to derive meaning of video data. This shows the locale-based inference results and expand with additional dashboards and dashboard playlists.

Figure 10: Grafana - Inference Analytics.

Figure 11: Grafana – More Inference Analytics.
By enabling data analytics through queries to Postgres on configured cameras, inference results as well as camera data, it is possible to then enable notifications through alert rules and notifications capabilities within Grafana. Alerting may leverage labels like security levels, or within certain namespaces of solution to then kick-off notification policies through Slack, email, or so on. For example, in this Smart City Situational Awareness Solution, alerting may be enabled when someone is in a place where they are not allowed. Security personnel could use this notification to better protect the area in real-time and take appropriate action thanks to data analytics from this Smart City data analytics solution.
Security & Privacy Considerations
The following considerations were made while designing this secure solution involving potentially identifiable information:
- Ensured files are inaccessible to unauthorized users.
- Application service authentication using authorization policies & tokens.
- TLS encryption for data transferred to/from HTTP APIs and UI.
- Encrypted RTSP URIs which may contain sensitive information.
- Vault was used to store sensitive data like username & passwords, certificates and private keys, authorization policies and tokens used by application services, as well as generate dynamic, temporary database credentials by following their baseline production hardening recommendations.
- Sensitive information is hidden by default in the UI.
- Mask facial details in video for privacy.
Conclusion
Designed as a reference implementation, this solution leverages Docker containers to wrap services with dependencies and deploys solution through Docker compose. It is simple to start services with “docker compose up.” This allows for an easily deployed Smart City data analytics solution with preconfigured dashboards and data sources. However, in a production-grade environment, one might use an elaborate orchestration solution to inject security credentials and handle startup/shutdown of media pipelines in response to configuration changes. This solution leverages Open-Source tooling, thereby eliminating the operational cost associated with deployment; it would be easy to deploy certain aspects of the modular microservice-based solution to Cloud in future larger-deployment-based scenarios. Hence, a highly customizable data analytics solution is enabled for smart city situational awareness at the Edge.
References
- Grafana: The Open Observability Platform. Grafana Labs. https://grafana.com/
- Build fast, reliable, and efficient software at scale. Go. https://go.dev/
- Group, P. S. Q. L. G. D. (2022, August 2). PostgreSQL. https://www.postgresql.org/
- Angular. https://angular.io/
- Inference Engine Developer Guide - OpenVINO™ toolkit. OpenVINO. https://docs.openvino.ai/2020.2/_docs_IE_DG_Deep_Learning_Inference_Engine_DevGuide.html
This article was edited by Bernard Fong.
To view all articles in this issue, please go to January 2023 eNewsletter. For a downloadable copy, please visit the IEEE Smart Cities Resource Center.


To have the eNewsletter delivered monthly to your inbox, join the IEEE Smart Cities Community.
Past Issues
To view archived articles, and issues, which deliver rich insight into the forces shaping the future of the smart cities. Older eNewsletter can be found here. To download full issues, visit the publications section of the IEEE Smart Cities Resource Center.
IEEE Smart Cities Newsletter Editors

Managing Editor

Assistant Managing Editor
IEEE Smart Cities Publications Editorial Board
Luis M. Fernandez-Ramirez
Bernard Fong
Sergii Kushch
Prasad Enjeti
Rabie Ramadan
Ramkumar Lakshminarayanan
Francesco Flammini
Fateh Krim
Maria Pia Fanti
Kristina Kunert
Vladimir Orlic
Asif Ali Ahmed R
Werbeston Oliveira
Emilio Ghiani
Shafi Khadem
Nikumani Choudhury
Mohammad Zeyad
S.M. Masum Ahmed
Payman Dehghanian
Sona N Thadevus
Kumaresan Natarajan
Lues Felipe Gaitan Cubides
Chao Shen
Balaji Sankarshanan
Chun Sing Lai
Zhang Wei
Shashikant Patil
Sai Munikoti
Akhil Jabbar Meerja
Click here for more info
Loi Lei Lai
Editor-in-Chief
IEEE Smart Cities eNewsletter